
Bad Graphs
In the wake of the announcement of Harvard's first wave of '18 admits, the Harvard Crimson is reports on the high-school demographics of Harvard's student body. The investigative article sheds some sunlight on just how much inequity exists between privileged "Harvard feeder schools" and the rest of the downtrodden teenaged proletariat.

That is, surprisingly little.
Oh, sure; the graph is concave. That means that...some schools sent more kids than other schools. Huh. How many more? Well, just reading the graph, something like 45% of Harvard students were the only admit from their school, and something like 78% are one of three or fewer kids from their high school. By contrast, the top schools send...15. A whopping five times more. Um. Right.
For contrast, this is what real inequity looks like:
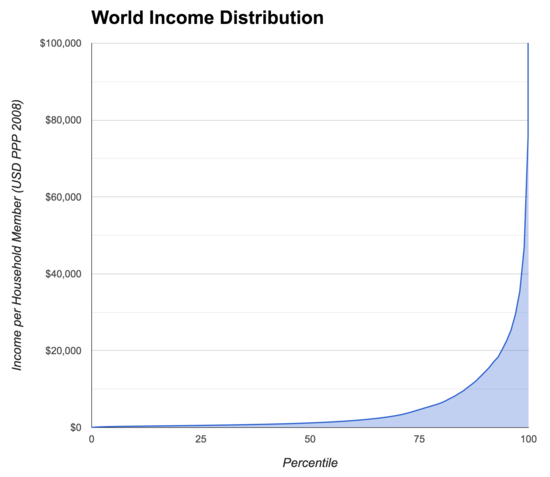 |
| Things on the right are people with obscene amounts of money. For reference, poverty-line America is ~95%tile. |
(Yes, they're graphing different things, but the mathematical point remains valid.)
Or, on a brighter note, the cost-effectiveness of different world health interventions:
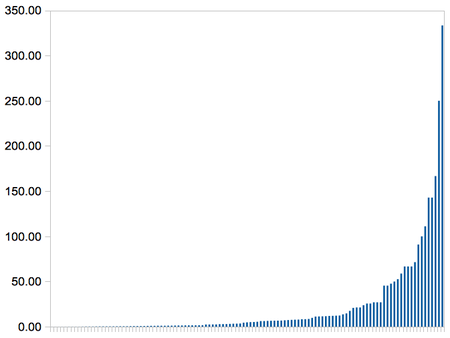 |
| Things are the right are awesome ideas we can be doing even more of. |
So yes, some high schools send ~15 students to Harvard every year. Some send one every ~4 years. The real problem, of course, is the high percentage of schools that never have sent a student to the Ivy Leagues, and never will. Or, for that matter, the gigantic percentage of people in this world who had the misfortune to be born in a place where education through high school wasn't mandatory, easy, or even available. But that, of course, doesn't show up on the Crimson's graph, because that wasn't part of the narrative the author intended. As far as I can tell, the article was only written to compile some quotes about how just how awesome Boston Latin / Andover / Stuyvesant / Noble / Exeter / Trinity / Lexington are.
And the misleading graph, of course, is a pretty good example of why informed members of the public really ought to have some grasp of basic statistics. Because, despite the "unequal distribution of high schools" that the Crimson's captioner calls attention to, I read this graph and see that Harvard's admissions office is going far out of its way to build a diverse class of students.